The following is a summary of the meteorological, glaciological, fluvial, and lacustrine datasets from a four-year monitoring campaign at Lake Peters. The methods and results are presented in more detail by Broadman et al. and the data are available through the Arctic Data Center. The results provide insight into the processes that control sedimentation in Arctic lakes, context for interpretation of lake sediment sequences, and data for calibration/validation of hydrological and sedimentological models.
Description of Lake Peters and its catchment
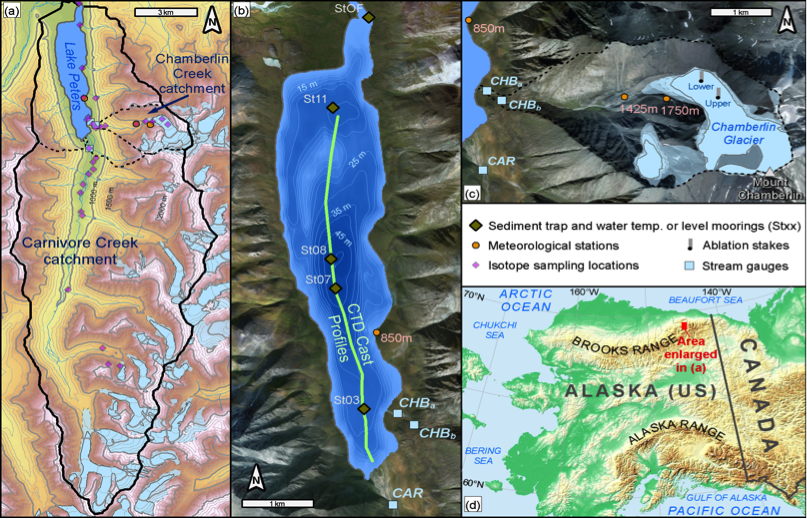
Lake Peters (69.32°N, 145.05°W) is located at 853 m above sea level on the north side of the Brooks Range. Its catchment includes the third tallest peak in the range, Mount Chamberlin (2712 m), which is 3 km east of Lake Peters. One of the largest glacier-fed lakes in Arctic Alaska, Lake Peters has a maximum water depth of 52 m and an area of ~6.4 km2. The lake’s catchment has 8% glacier cover based on aerial photography acquired in 2016, and receives a majority of stream flow from Carnivore Creek, a 128 km2 catchment with 10% glacier cover. The Carnivore Creek catchment encompasses six extent glaciers larger than 0.5 km² and numerous smaller glaciers, with a median elevation for all glaciers at 1910 m. Since the Little Ice Age, the largest glaciers have reduced in length by over 30%. Chamberlin Creek is the second largest inflow to Lake Peters. It has a 8 km2 catchment area that is 21% covered by Chamberlin Glacier. Lake Peters drains to the north into Lake Schrader, whose outflow, the Kekiktuk River, discharges into the Sadlerochit River and ultimately the Arctic Ocean. Lake Peters and Lake Schrader (Neruokpuk Lakes) are ice covered from early October through mid-June or July, and often thermally stratify. The basin is north of the modern tree line in a region underlain by continuous permafrost, with a thin active layer where soils are rocky, excessively drained, strongly acidic, and have very thin surface organics. Bedrock within the basin is Devonian – Jurassic sedimentary to meta-sedimentary rocks primarily of the Neruopuk Formation. Climate at Lake Peters is semi-continental, with temperatures more extreme than locations on the coastal plain. A short observational time series of weather from Lake Peters was initiated during the International Geophysical Year in 1962. For the year between May 1, 2015 and April 30, 2016, weather stations installed in Lake Peters basin recorded an hourly averaged temperature of -9.8°C and a liquid precipitation total of 166 mm. During this time period, average temperature was -29°C in December and 8.5°C in July. Strong temperature inversions develop during the winter, with differences as large as 15°C between 850 and 1425 m.
Meteorological Data
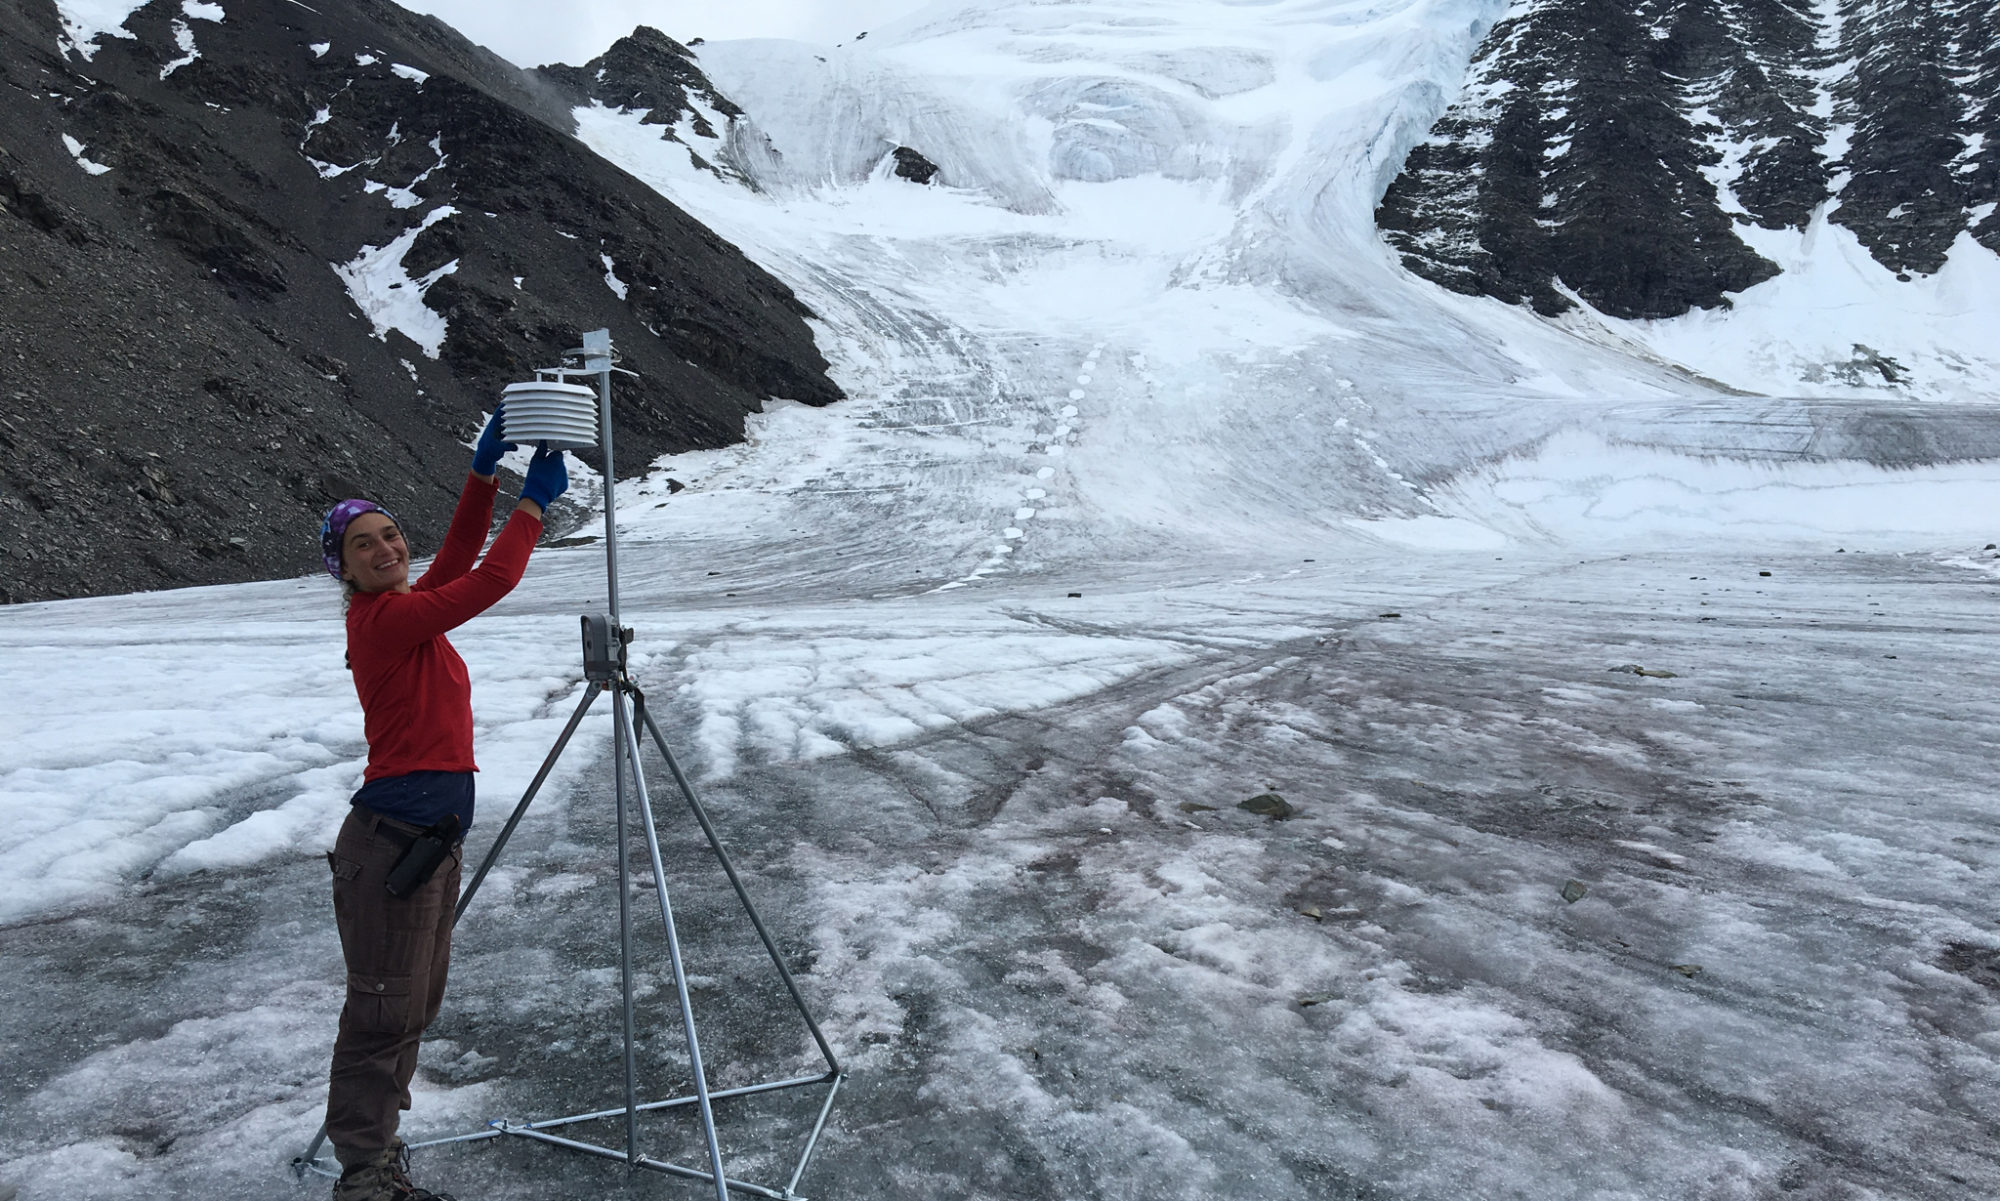
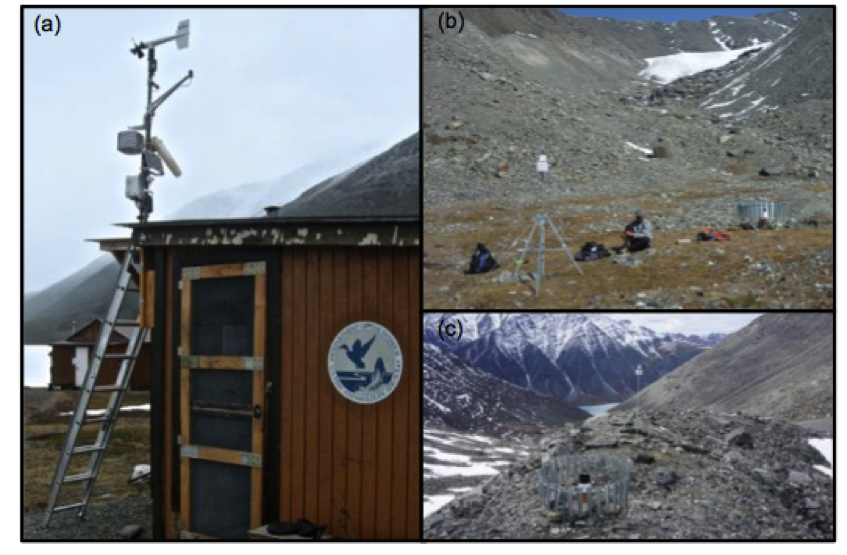
Three weather stations operated in the catchment from May 2015 through August 2018 along an elevational gradient. The lowest elevation station was mounted on the roof of the cabin at the research station at 850 m near Lake Peters. Additional stations were installed on tripods at 1425 m inside the Little Ice Age moraine of Chamberlin Glacier, and the highest elevation station was at 1750 m at the crest of the left lateral moraine of Chamberlin Glacier. All three stations were equipped with air temperature and relative humidity sensors and ground temperature sensors at 2 and 30 cm depth. The 850 and 1425 m stations were equipped with backup air temperature and relative humidity sensors. The 850 m station was additionally equipped with a barometer, an anenometer, and a pyranometer. At all three stations, tipping bucket rain gauges were installed on the ground away from the stations and equipped with Alter-type windshields to reduce wind-related undercatch.
Glaciological Data
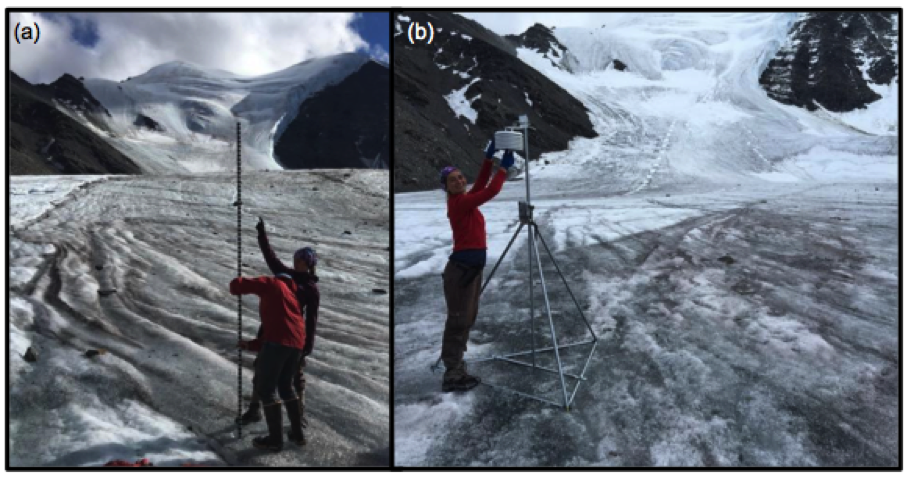
The surface elevations of Chamberlain Glacier and seasonal snow cover were observed using ablation stakes and interval photography. Graduated stakes were installed at two sites along the lower (1772 m) and upper (1860 m ) regions of the glacier. Photographs captured exposed stakes height using time-lapse cameras that automatically recorded every 6 hours. Ablation stake heights were observed on photographs at a precision of 1 cm. Air temperature sensors recorded mean hourly temperatures 2 m above the snow surface at each site.
Fluvial Data
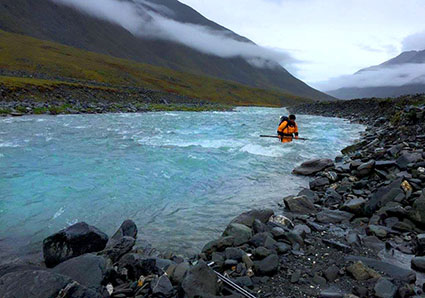
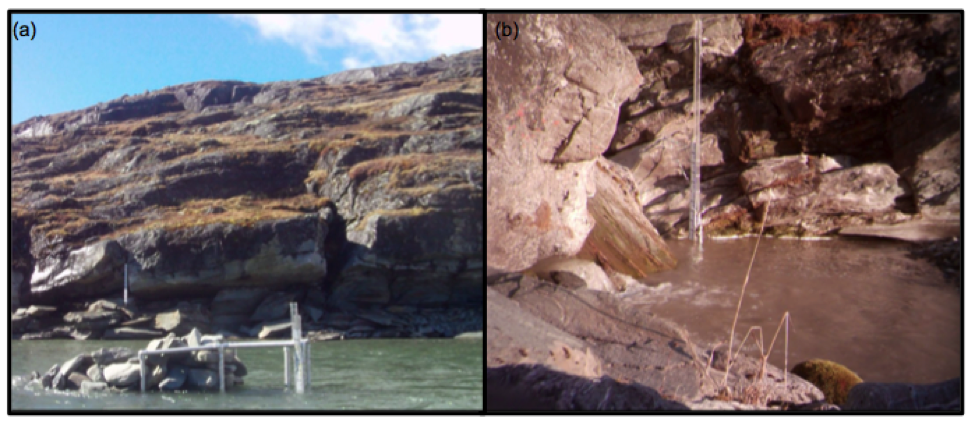
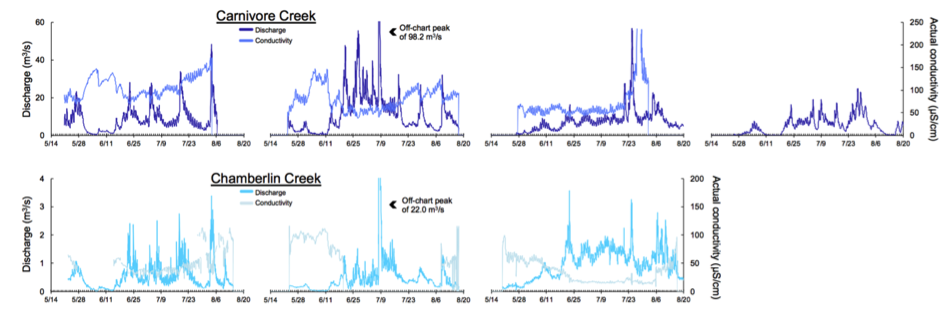
Two hydrological stations were established in May 2015: one at Carnivore Creek and one at Chamberlin Creek. At each station, an In-Situ TROLL 9500 was deployed during the open-channel season to measure pressure, temperature, conductivity, and turbidity, and a water level logger was used for backup measurements of pressure and temperature. In addition to these continuous datasets, discrete discharge (Q) and suspended sediment concentration measurements were taken using a hand-held flow meter and a suspended sediment sampler. Water pressure was corrected using barometric pressure measurements from the 850 m weather station and then converted to stage. Discrete field sampling of discharge was most frequent and spanned the greatest range in 2015.
Limnological Data
Hourly water level measurements were taken using water level loggers installed on anchored moorings near the water’s surface at two locations in Lake Peters: one in its central basin and one near its outflow. Pressure data were corrected to water depth using barometric pressure measurements from the 850 m weather station. Throughout the 2015 field season, a series of TROLL cast transects were taken to provide temperature, turbidity, and conductivity data at stations along a north-south transect throughout Lake Peters. Pressure measurements from the TROLL were converted to water depth, providing vertical profiles for these data. These casts were performed at a varying number of stations on a total of 33 days over the course of the field season. In 2015, 2016, and 2017, lake temperature and luminous flux data were collected at various water depths on anchored moorings throughout the lake.
Sediment Trap Data
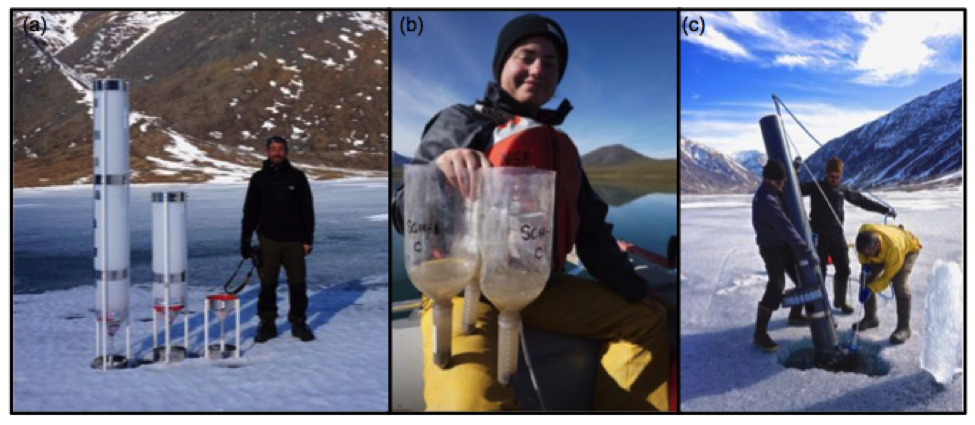
Throughout 2015-2017, sediment traps were deployed in Lake Peters to measure the rate of deposition and collect suspended sediments in the lakes. In 2015, three pairs of static traps with different aspect ratios were deployed from May-August at a central location of Lake Peters to determine the effect of these proportions on sediment collection efficiency. From May-August 2016 and again from August 2016 through August 2017 one static trap was deployed in Lake Peters. This trap consisted of 2 L plastic bottles with the bottoms removed, a 50 ml centrifuge tube secured to its mouth, and inverted to funnel sediments into the tubes. Each trap comprised two or three replicate tubes/bottles deployed at different depths along an anchored mooring. In addition, an incrementing sediment trap was deployed from May 2016 through August 2017, collecting sediments in 23 bottles rotating over daily to weekly increments. For all sediment samples, dry sediment mass, daily flux, and annual flux were calculated. For several static trap samples, grain size data were determined.
Photogrammetric Data
Airborne photogrammetric data were acquired two times in 2015, three times in 2016, and three times in 2017. These data were used to create raster orthomosaics and digital elevation models. When conditions permitted, the entire Carnivore Creek watershed was acquired. On all other dates, only the eastern side of the valley, where the catchment glaciers are located, was captured. Accuracy within this steep mountain environment was found to exceed 20 cm horizontally and vertically without use of ground control. Data acquisition methods are described in detail in Nolan et al. (2015). These DEMs were used to create difference DEMs to measure snowpack thickness throughout the entire watershed (spring minus late summer for each year), as well as glacier surface elevation change (August of one year minus August of the following year). The accuracy of these DEM-derived snow thickness measurements has previously been found to be comparable to those acquired using hand probes.
Geochemical Data
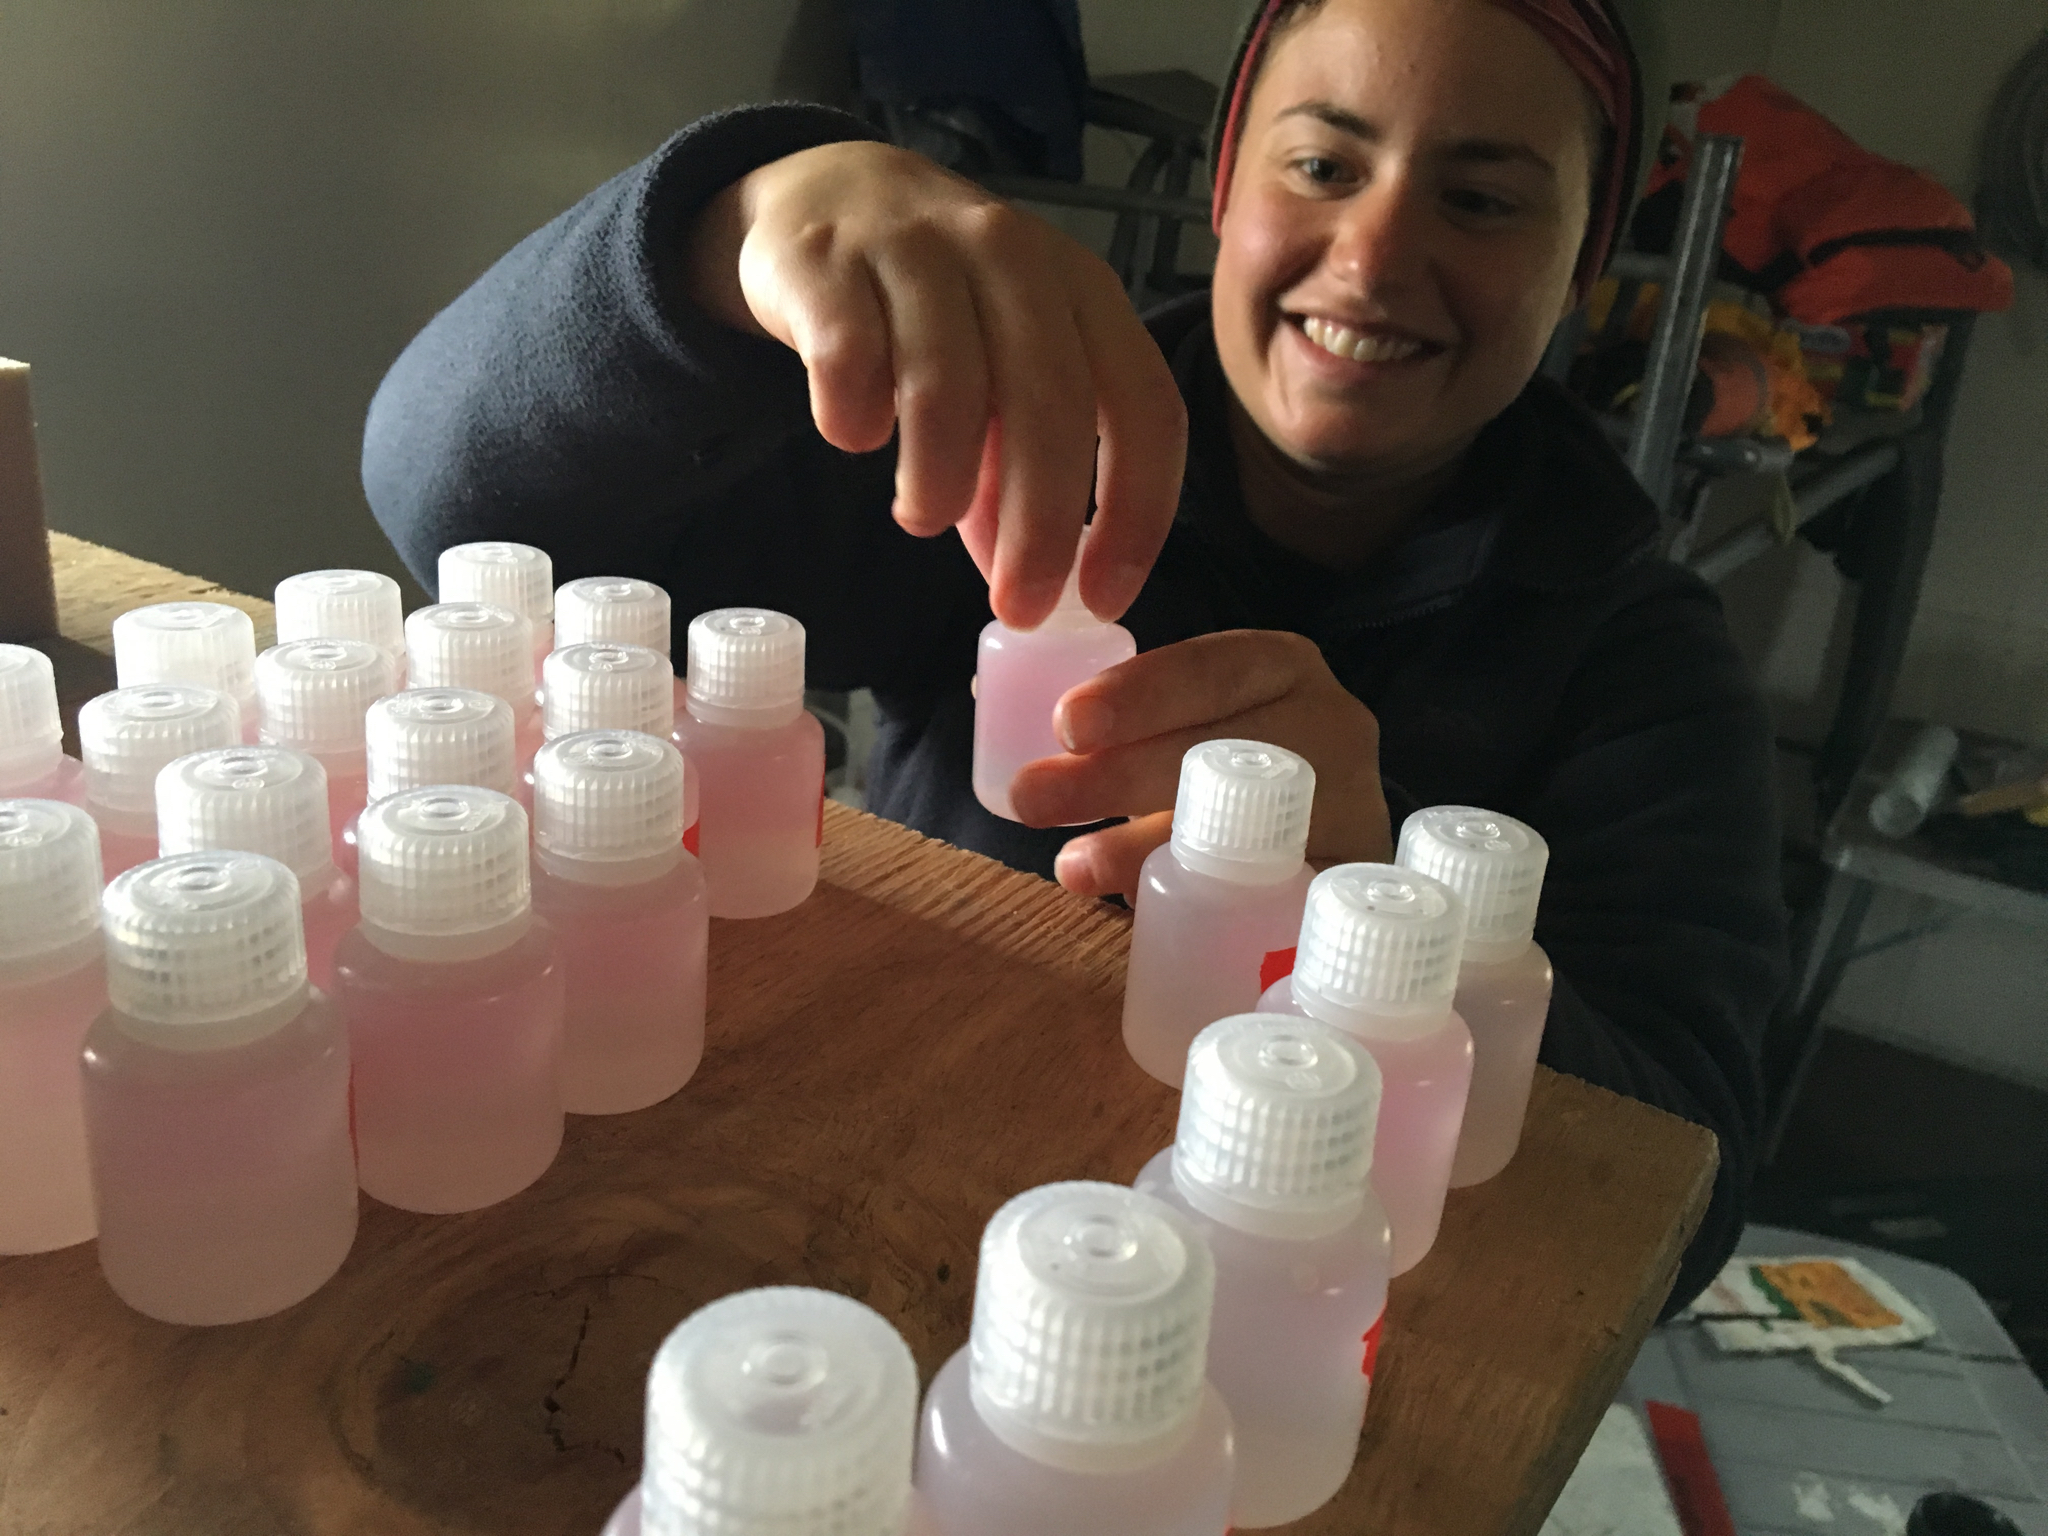
A total of 187 water samples were collected from the Lake Peters catchment between 2015 and 2018 and analyzed for oxygen and hydrogen isotopes. These data, combined with conductivity measurements, were input to a hydrograph mixing model to estimate the relative contributions of various water sources to Carnivore and Chamberlin Creeks. Sampling intervals varied by location but were approximately every 2-6 days when a field team was present. In one 24-hour period in August 2016, each creek was sampled every two hours. These Creek samples were also analyzed for major cation and anion geochemistry analysis using an ion chromatograph. Water samples were also collected from three unnamed glaciated tributaries in the Carnivore Creek valley and three unnamed non-glacial streams that intermittently drain into Lake Peters. Winter precipitation samples were collected from multiple locations. Twenty-seven snowpack samples were collected with snow density measurements. Samples of glacial melt, glacial ice, and snow drifts were collected. Rain samples were collected sporadically after storm events from spill off from the roof of G. William Holmes research station.
Tracing a Precipitation Event
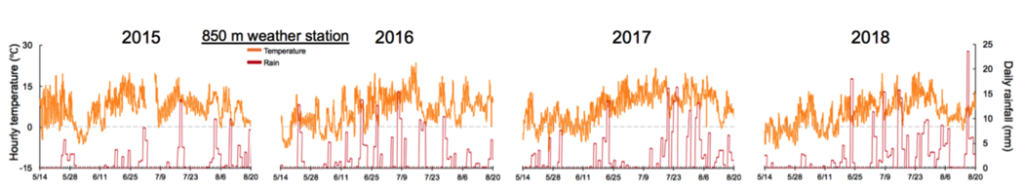
To examine how precipitation works its way through the Lake Peters catchment system, and to depict a small subset of the available data, multiple datasets are shown for a precipitation event in the latter half of July 2015 (see figures below). During this event, the 850 m weather station recorded a total rainfall of 22.4 mm between July 17-20. In response, hydrological stations at both Carnivore and Chamberlin Creeks recorded an increase in discharge to Lake Peters, with Carnivore Creek discharge reaching far higher values due to its larger catchment. Discharge then decreased over several weeks, long after the precipitation event concluded, with diurnal fluctuations illustrating the effect of glacial melt. Turbidity increased in both creeks, coincident with the beginning of elevated discharge. The influx of water increased the water level of Lake Peters, which lagged, likely as a function of the total integration of new water as well as outflow into Lake Schrader. This event had several additional effects on the water of Lake Peters: Turbidity in Lake Peters increased during the event, the inflow of water caused a temporary drop in water temperatures closer to the lake surface, and the amount of luminous flux a few meters below the water’s surface dropped. Isotopic values were also recorded from rainfall and creekwater at several moments during this event.
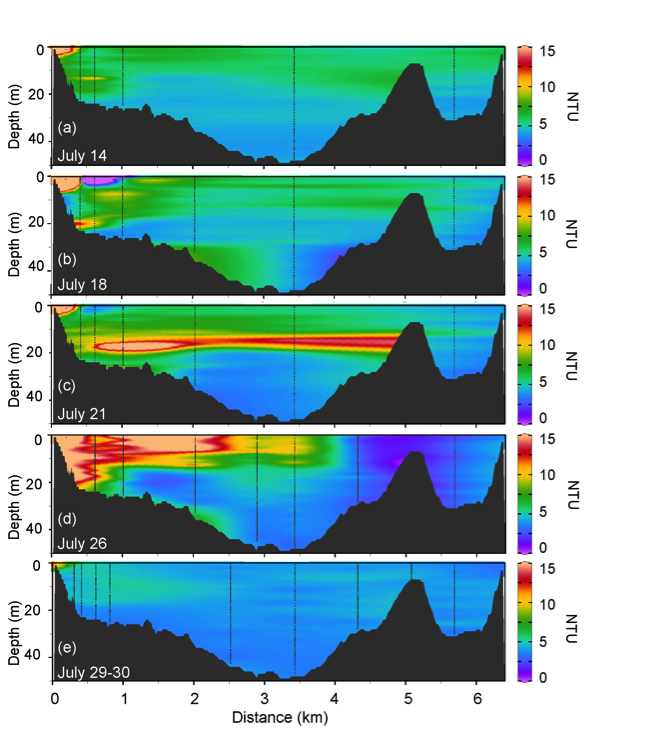
To quantify the spatial characteristics of the sediment pulse entering Lake Peters during this precipitation event, data from TROLL casts taken throughout the lake on multiple days before, during, and after the event were examined. These data indicate that the spatial pattern of turbidity anomalies throughout Lake Peters is more complex than that captured at a single, proximal station.
This multifaceted perspective of a precipitation event represents only a small fraction of the total data produced by this field effort, but illustrates both the interconnectedness of processes in the Lake Peters catchment and the potential for these datasets to further our understanding of Arctic weather-glacier-river-lake systems dynamics.
Acknowledgements
Datasets from the Lake Peters watershed were collected with the help of numerous field assistants, including Zak Armacost, Mindy Bell, Ashley Brown, Anne Gädeke, Jeff Gutierrez, Rebecca Harris, Stacy Kish, Lisa Koeneman, Anna Liljedahl, Maryann Ramos, Doug Steen, and Ethan Yackulic. Sedimentary grain size data were processed with assistance from Daniel Cameron and Katherine Whitacre. Water isotope analyses were performed with assistance from Jamie Brown at NAU’s Colorado Plateau Stable Isotope Facility, and major cation and anion analyses were performed by Tom Douglas of the U.S. Army Cold Regions Research and Engineering Laboratory. We thank the U.S. Fish and Wildlife Service – Arctic National Wildlife Refuge for use of the G. William Holmes research station and for permitting our research; Polar Field Services, Inc./CH2MHill for support and outfitting while in the field; Dirk Nickisch and Danielle Tirrell of Coyote Air for safely flying our field teams to and from Lake Peters; LacCore/CSDCO for assistance with processing and archiving of sedimentary sequences from Lake Peters; and PolarTREC for a productive partnership that contributed greatly to the broader impacts of this project. This project was funded by NSF-1418000. Forgive us if we neglected to acknowledge anyone. Please let us know if we missed you.