Introduction

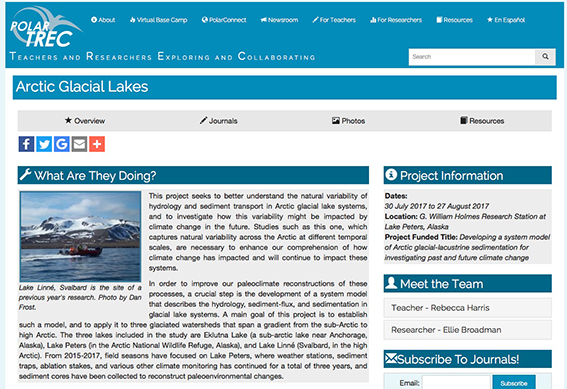
The Arctic Glacial Lakes project was funded by the US National Science Foundation, Arctic System Science Program from 2015 to 2018, with the goal of understanding how weather and climate are filtered through the glacier-hydrology-lake-sedimentation system and are recorded in physical components of lake deposits in glaciated catchments. The study was motivated by the need to improve interpretations about past and present environmental changes that are recorded by sediments that accumulate in Arctic lakes. The focus was on lakes in glaciated watersheds because their sediment often reflects changes in the size and melt rate of upstream glaciers, which are among the most dynamic components of the rapidly evolving Arctic system.

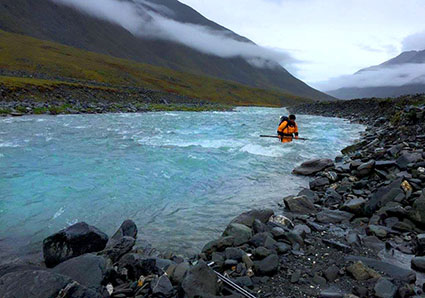
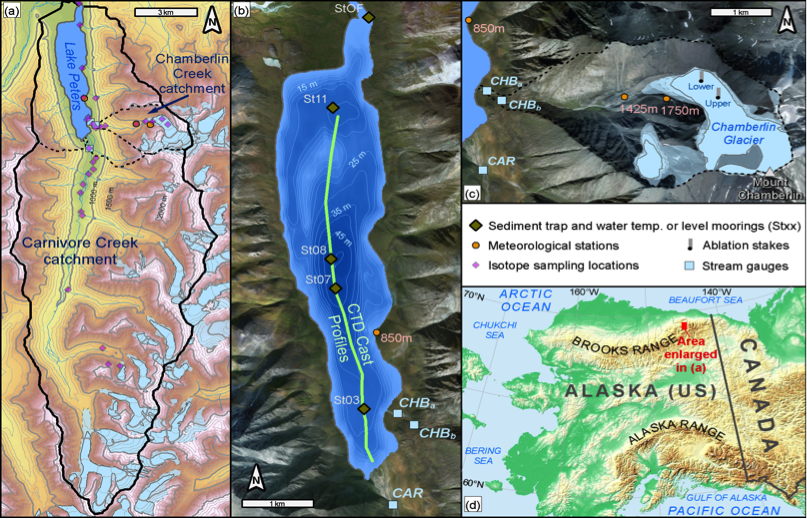
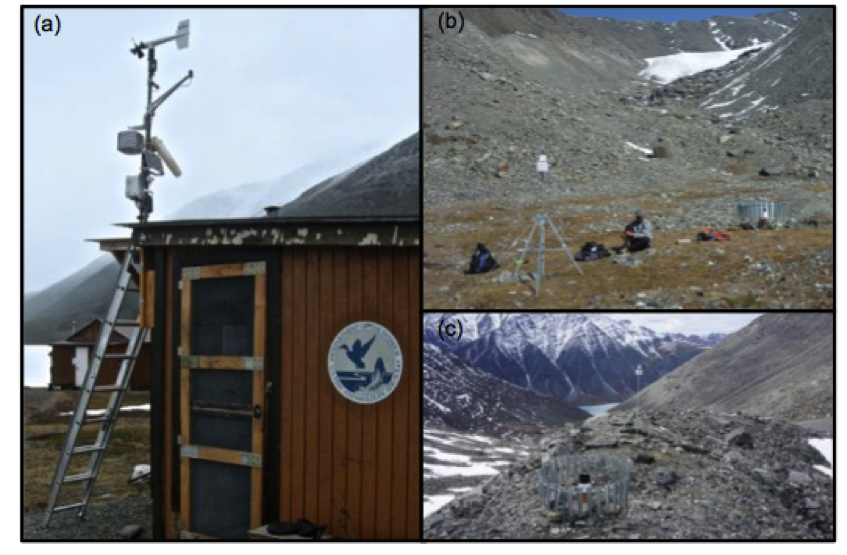
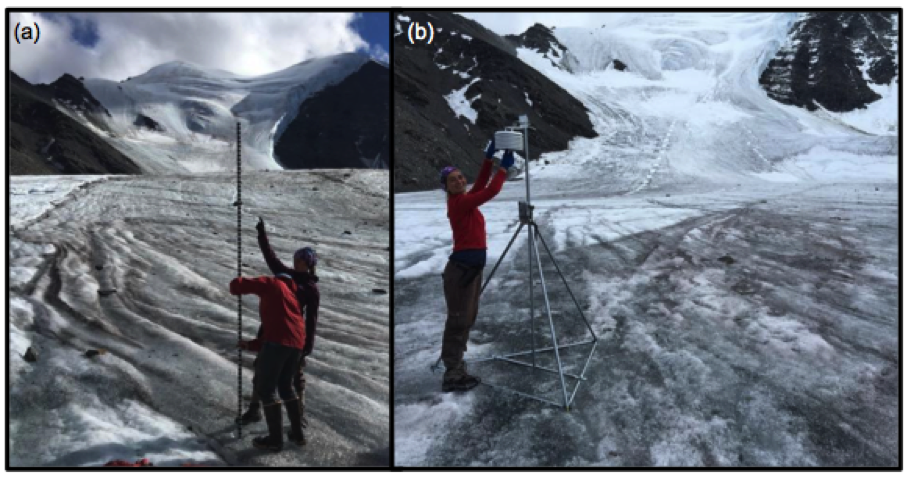
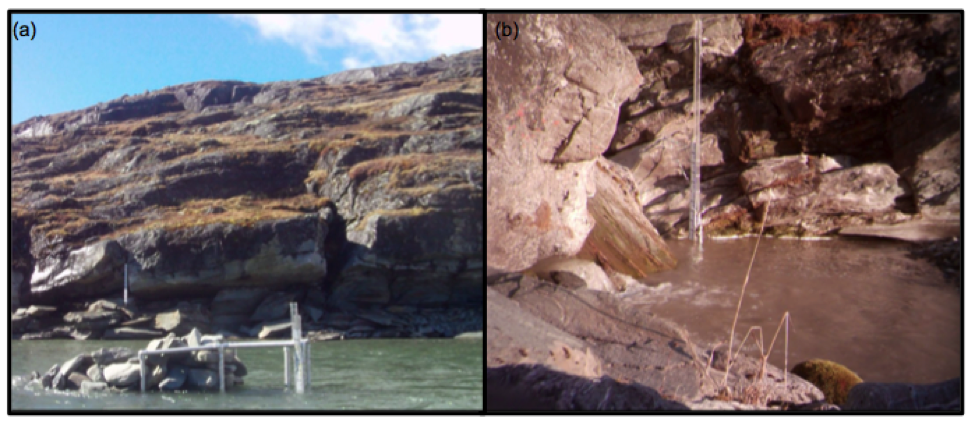
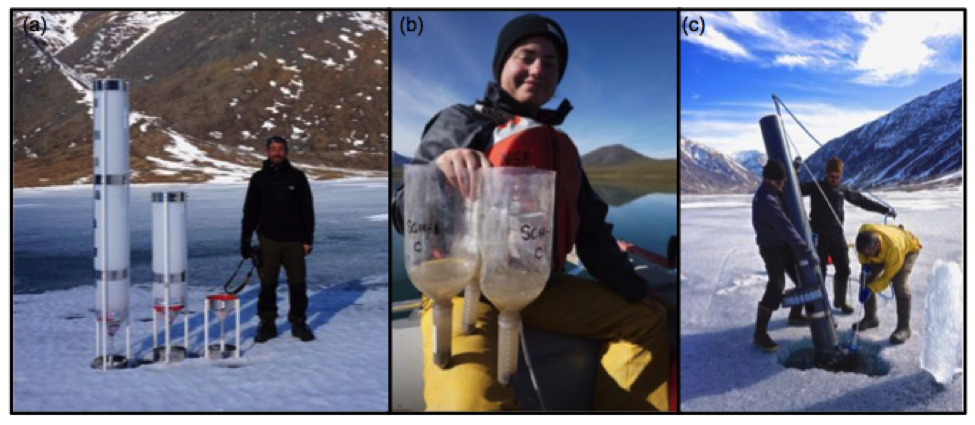
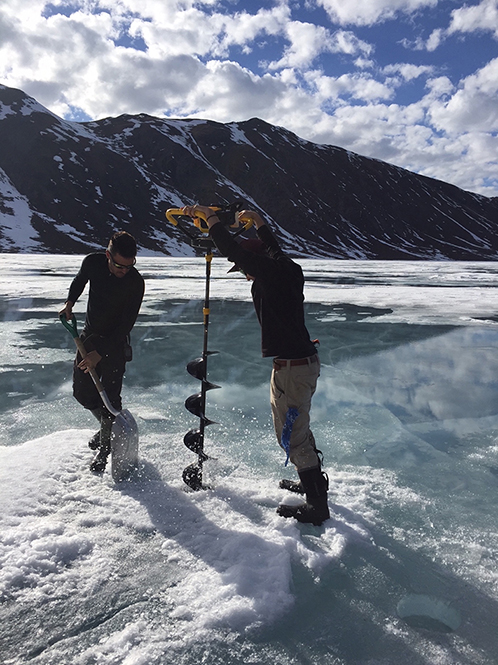
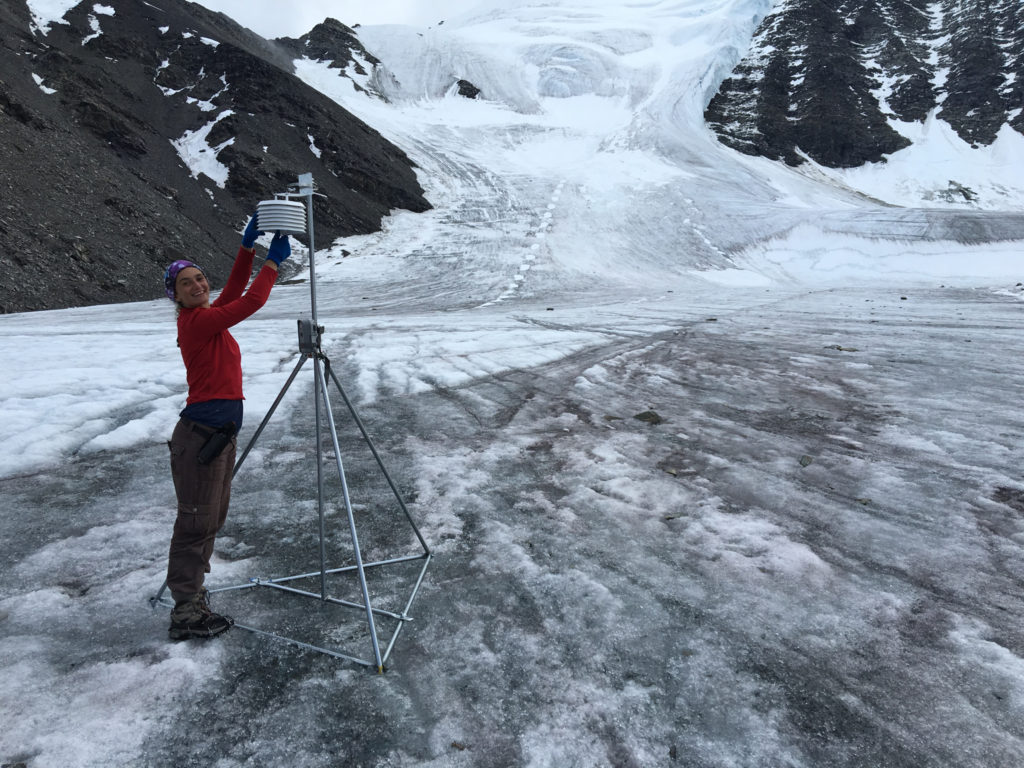
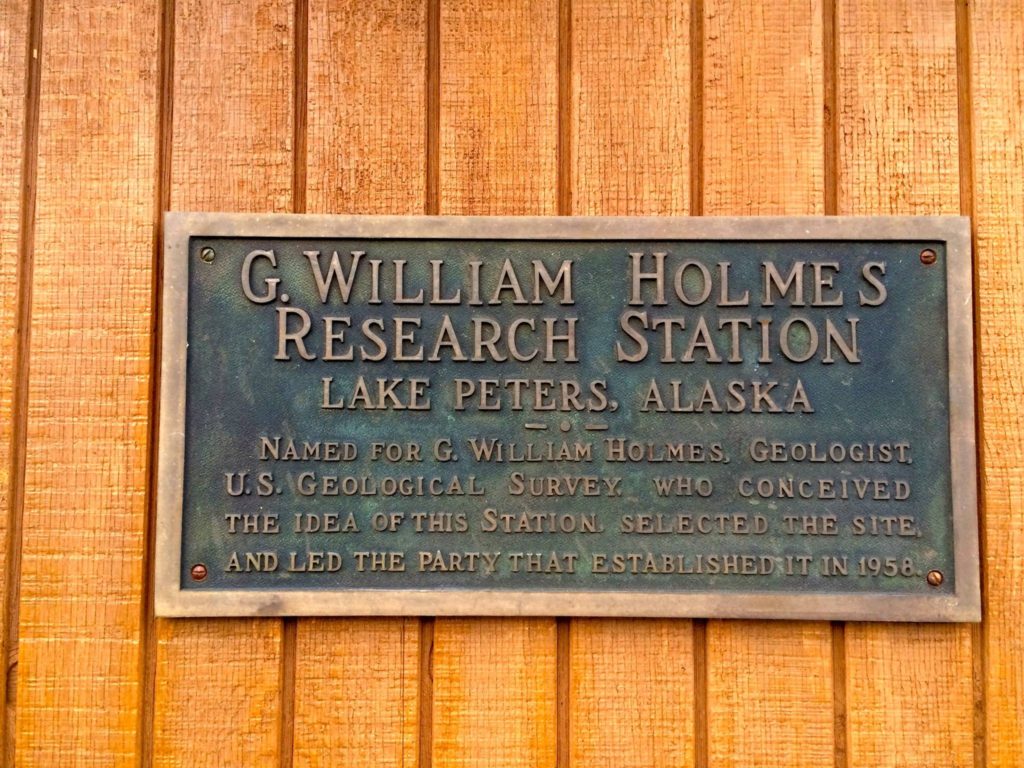
This project established a watershed observatory at Lake Peters, Alaska, where we observed multiple weather, glacier, river and lake processes. The resulting datasets are featured in the journal, Earth System Science Data, they are summarized in the “observatory data” section of this website, and are archived in full at Arctic Data Center. We also developed similar monitoring datasets at Eklutna Lake, and rescued seven years of similar datasets at Lake Linne.

The results show:

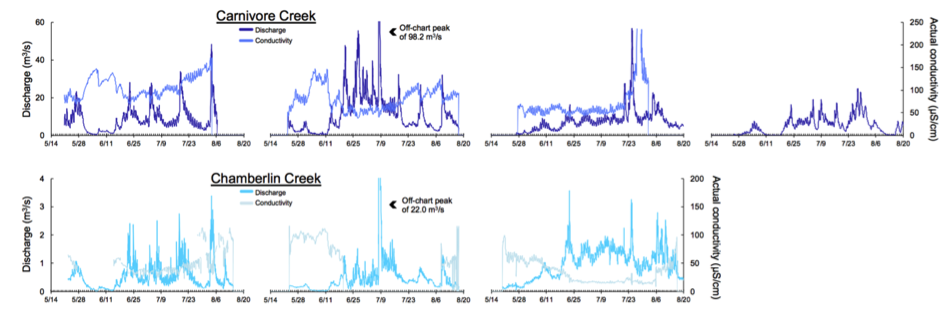
(1) Sediment transport to all three lakes exhibits significant inter-annual variability. This emphasizes the need for long-term monitoring studies and the challenge of deriving robust conclusions from short instrumental records. This also motivates the use of proxy records to infer long-term trends and variability.

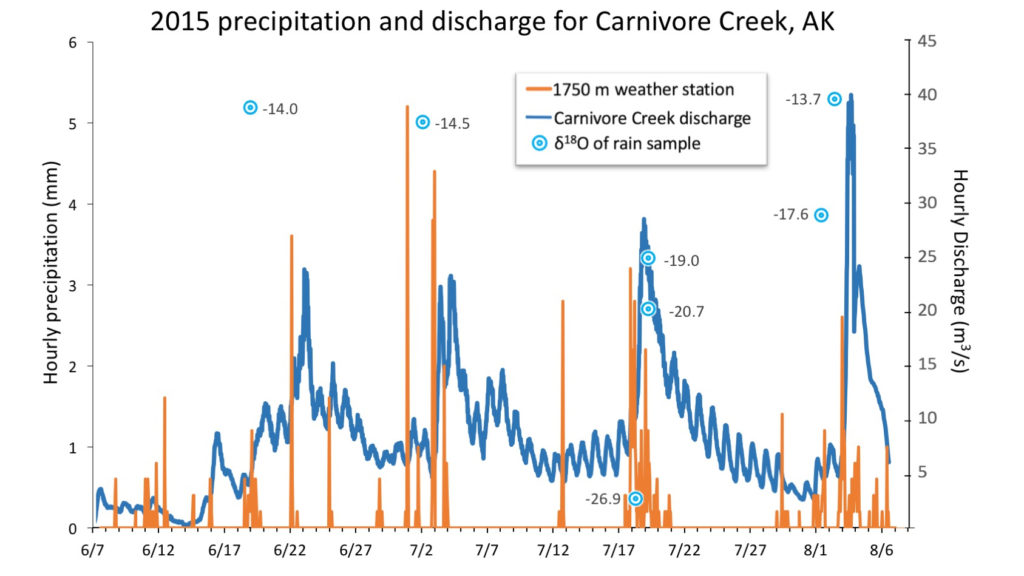
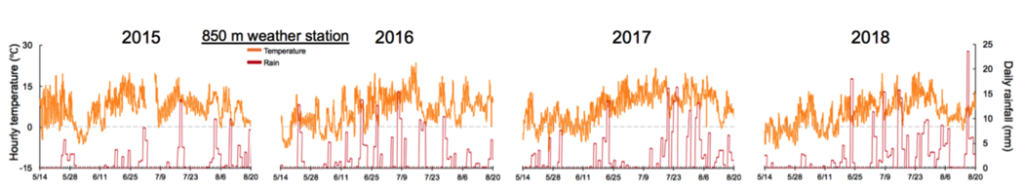
(2) Rainfall dominates discharge hydrography and controls sediment transport at all three study lakes. This was expected for south Alaska, but is surprising in the Arctic, and has implications for the future of the Arctic where rainfall is projected to continue to increase. This finding also challenges some proxy-based reconstructions that relate sediment accumulation to summer melt temperature.

(3) River discharge, primarily driven by rainfall, is a key predictor variable for sediment transport in all three catchments, although sediment yield models developed for this project performed best when meteorological or temporal explanatory variables were also included.

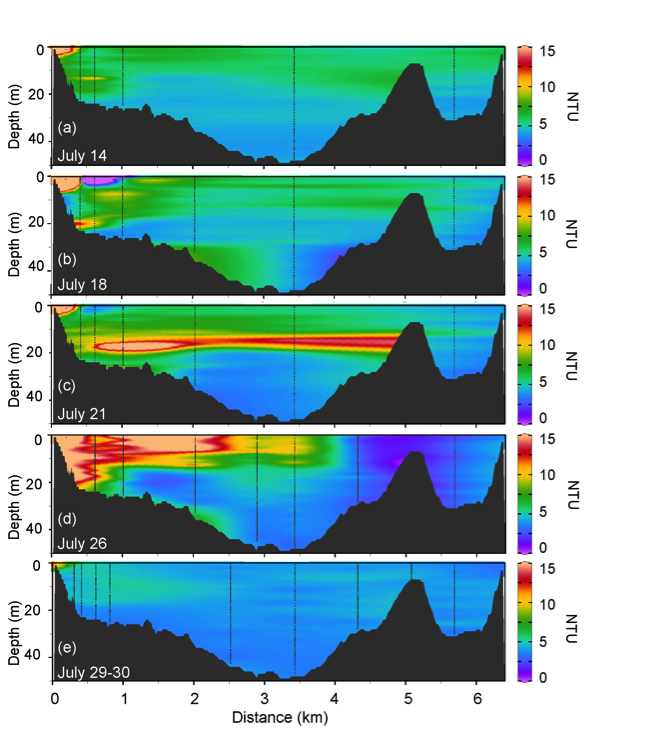
(4) Our sediment transport model for the Lake Peters watershed was linked to a lake sedimentation model to simulate how changes in discharge, driven by precipitation and glacier melt, are ultimately recorded as sedimentation in the lake. The model does a good job of simulating the overall amount of annual and total sediment deposition from 2015-2017, as well as the relative amounts in each year, and the changes in deposition rates as a function of distance from the inlet.

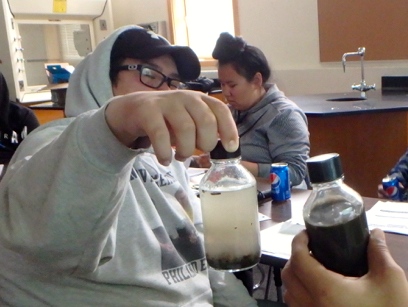
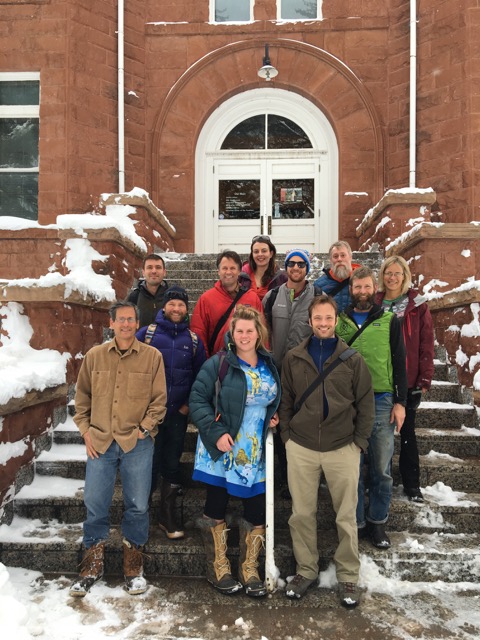
We shared our project activities and results beyond of the scientific community. In 2017 we teamed up with PolarTREC to host high school teacher Rebecca Harris at Lake Peters. Her experiences are documented here. She and Ph.D. student Ellie Broadman shared our project with students at Kaktovik school and through webinars. We communicated regularly with the interested public, land managers, and to other scientists on the project facebook page.

Projects

Propagation of fluvial sediment pulse into Lake Peters

– David Fortin

This project aims to better understand how river discharge, fluvial suspended sediment concentration (SSC), and lake thermal conditions influence sediment dispersion within Lake Peters. During the summer of 2015 fluvial inputs into Lake Peters, including SSC and water temperature, were monitored every 30 minutes for nearly three months. The turbidity and temperature of Lake Peters were measured regularly at sub-meter depth intervals across the lake. In addition three moorings located along the long axis of the lake were equipped with sensors, recording water temperature at different depths, at hourly or sub-hourly resolution. We observed overflows that were quickly transformed into interflows as the density of fluvial inflow changed with water temperature and SSC. During an exceptionally high discharge event in August, a sediment-rich underflow quickly propagated along the lake bed and was later transformed into an interflow as the SSC decreased by apparent settling of the coarser particles. Our results also show that not all sediment pulses reach the distal basin. These data sets highlight the variety of spatial sediment transfer patterns in Lake Peters from one fluvial event to another.

A. Bathymetric map of Lake Peters with 5m contour intervals. The black dots represent the location of the profiles used to produce the interpolated maps in panel B. Figure B, shows a sediment rich plume in Nephelometric Turbidity Unit (NTU) during two consecutive days. On August 4, a storm event translates into a sediment rich underflow, which, after losing some of its sediment load, travels down the lake as an interflow the next day.

Empirically Based Sediment Flux Model

– Lorna Thurston

Seasonal suspended sediment transfer in glaciated catchments is responsive to meteorological, earth surface, and glacier-stream conditions, and thus is a useful indicator of environmental system dynamics. Knowledge of stream sediment-transfer processes is limited in the Arctic–a region sensitive to contemporary environmental change. For two glaciated sub-catchments at Lake Peters, northeast Brooks Range, Alaska, we conducted a two-year endeavor to monitor hydrology and meteorology, and used these data to derive multiple-regression models of fluvial suspended sediment load for the 2015 and 2016 open-channel seasons (Figure below). We also undertook a lake-based study, for which we constructed spatial models of sediment dry bulk density based on distance from the primary inflow to the lake and lake water depth. We used the spatial models to calculate average sediment yield over ca. 42 years to improve our understanding of catchment-scale sediment transfer and gain knowledge of within-lake processes. Using both methods, specific suspended sediment yields (i.e. suspended sediment mass per unit of catchment area, annually) to Lake Peters were in the order of 50 Mg km-2 yr-1. During 2015 and 2016, suspended sediment transfer to Lake Peters was primarily influenced by rainfall, and secondarily influenced by temperature-driven melt processes. Although 2016 was a year of above average sedimentation, the last extreme depositional event at Lake Peters probably occurred between 1970 and 1976 when a basal lens of fine sand was deposited.

Time-series of 2015 and 2016 open-channel season suspended sediment concentration (SSC) in Carnivore (CAR) and Chamberlin (CHB) Creeks, Lake Peters, Brooks Range, Alaska, respectively, predicted using turbidity (NTU)-based and discharge (Q)-based multiple-regression models, with manual SSC samples overlaid. The axis is loge transformed.

16,000 Years of Paleoenvironmental Change from the Lake Peters-Schrader area, Northeastern Brooks Range, Alaska

– Christopher Benson

Paleoclimate reconstructions are essential to contextualize recent warming that is affecting the Arctic region faster than anywhere else on Earth. To better understand this rapidly changing landscape, sedimentological evidence from Lake Peters and Lake Schrader in the northeastern Brooks Range was used to infer changing environmental conditions over the past 16,000 years (16 ka). Across five core sites, distinct changes in the visual stratigraphy and physical sediment properties including sediment bulk density, organic-matter content, and grain-size distributions record changing environmental conditions. The oldest sediments accumulated rapidly and contain little organic matter, interpreted to represent a landscape dominated by paraglacial processes and the rapid upvalley retreat of glaciers. No robust evidence was found for a climate fluctuation concurrent with the Younger Dryas. A peak in organic-matter abundance between 12–10 ka is attributed to a maximum in orbitally driven insolation and accords with other regional paleoclimate reconstructions. Following this, conditions appear to have become drier as indicated by sediments with high density and low organic content until 5 ka. From 5–2 ka, organic matter consistently increases in several cores and is attributed to increased river discharge, which carried terrestrial organic matter into the lake, or to increased summer temperatures, which led to higher productivity, or both. After 2 ka, sediments increase in density and decrease in organic content, which suggest the growth of glaciers within the catchment. Moraine mapping and lichenometry confirm previous studies and accord with changes in lake sediments. Rhizocarpon geographicum thallus diameters on boulders located on the outermost moraine crest suggest the maximum Holocene glacial extent is associated with increased moraine frequency from elsewhere in the Brooks Range dating to 2.5–1.9 ka. New measurements from a distinct moraine crest from an additional valley show consistency within the basin and are likely associated with a regional increase in moraine frequency from 1.1–1.0 ka. Increased sedimentation rates and organic productivity in both lakes may record glacier retreat during the last century. This study provides a framework for future research and fills an important gap in paleoenvironmental records for the northeastern Brooks Range.

DETERMINING MODERN HYDROLOGICAL INPUTS WITH A VOLUMETRIC MIXING MODEL

– Rebecca Ellerbroek

The glaciers of Arctic Alaska serve a crucial ecological role, regulating streamflow between precipitation events and delivering nutrient-rich sediment to streams and lakes. As global warming melts glaciers and changes precipitation regimes, it is particularly important to understand the hydrological inputs that compose streamflow in quickly evolving Arctic basins. This research will use stable isotopes to constrain relative contributions of rain, snow and glacial melt to Lake Peters, with the objective of contributing to a predictive hydrological model. Lake Peters is an ideal location for a hydrograph separation study because of its numerous inflows that range from completely non-glacial to primarily glacial runoff, allowing for comparison across subbasins. Deuterium and oxygen will be used in a volumetric mixing model with summer precipitation and winter-accumulated melt as end members. While summer precipitation is enriched in heavy isotopes and winter precipitation is depleted, there are several other factors that affect meteoric isotopic composition, such as source water and distance traveled. HYSPLIT storm trajectory modeling will be used to distinguish seasonal isotopic differences from other types of isotopic fractionation.

PARTNERS: Northern Arizona University, University of Alaska Fairbanks, Alaska Pacific University, CH2MHill-Polar Services, US Fish and Wildlife Service Arctic Refuge, Fairbanks FODAR, Svalbard REU

FUNDER: National Science Foundation Arctic System Science

Products

Peer reviewed journal articles

Thurston, L.L., Schiefer, E., McKay, N.P., Kaufman, D.S., in review. Suspended sediment deposition and sediment yields at Lake Peters, northeast Brooks Range, Alaska: Fluvial- and lake-based approaches. Hydrological Process

Thomas, J.E., Kaufman, D.S., Praet, N., McKay, N.P., Van Daele, M., Jensen, B.J.L., De Batist, M., 2021. A 2300-year record of glacier fluctuations at Skilak and Eklutna Lakes, south-central Alaska. Quaternary Science Reviews 272, 107215. doi: 10.1016/j.quascirev.2021.107215

Schiefer, E., Geck, J., Ostman, J., McKay, N., Praet, N., Loso, M., Kaufman, D., 2021. Fluvial suspended sediment transfer and lacustrine sedimentation of recent flood turbidites in proglacial Eklutna Lake, western Chugach Mountains, Alaska. Hydrological Processes 35, e14375. doi: 10.1002/hyp.14375

Broadman, E., Kaufman, D.S., Henderson, A.C.G., Malmierca-Vallet, I., Leng, M.J., Lacey, J.H., 2020. Coupled impacts of sea ice variability and North Pacific atmospheric circulation on Holocene hydroclimate in Arctic Alaska. Proceedings of the National Academy of Sciences 117, 33034-33042. doi: 10.1073/pnas.2016544117

Thurston, L.L., Schiefer, E., McKay, N.P., Kaufman, D.S., 2020. Modeling suspended sediment discharge in a glaciated Arctic catchment–Lake Peters, northeast Brooks Range, Alaska. Hydrological Processes 34, 3910-3927. doi: 10.1002/hyp.13846

Benson, C.W., Kaufman, D.S., McKay, N.P., Schiefer, E., Fortin, D., 2019. A 16,000-year-long sedimentary sequence from Lakes Peters and Schrader (Neruokpuk Lakes), northeastern Brooks Range, Alaska.  Quaternary Research 92, 609-625. doi: 10.1017/qua.2019.43

Broadman, E., Thurston, L.L., McKay, N.P., Kaufman, D.S., Schiefer, E., Fortin, D., Geck, J., Loso, M.G., Nolan, M., Arcusa, S.H., Benson, C.W., Ellerbroek, R.A., Erb, M.P., Routson, C.C., Wiman, C., Wong, A.J., 2019. An Arctic watershed observatory at Lake Peters, Alaska: weather-glacier-river-lake system data for 2015-2018.  Earth System Science Data 11, 1957-1970. doi: 10.5194/essd-2019-60

Fortin, D., Praet, N., McKay, N.P., Kaufman, D.S., Jensen, B.J.L., Haeussler, P.J., Buchanan, C., De Batist, M., 2019. New approach to assessing age uncertainties – The 2300-year varve chronology from Eklutna Lake, Alaska (USA). Quaternary Science Reviews 203, 90-101. doi: 10.1016/j.quascirev.2018.10.018

Schiefer, E., Kaufman, D., McKay, N., Retelle, M., Werner, A., Roof, S., 2018. Fluvial suspended sediment yields over hours to millennia in the High Arctic at proglacial lake Linnévatnet, Svalbard. Earth Surface Processes and Landforms 43, 482-498. doi: 10.1002/esp.4264

Graduate theses

Benson, C., 2018. 16,000 Years of paleoenvironmental change from The Lake Peters-Schrader Area, Northeastern Brooks Range, Alaska.  MSc thesis, Northern Arizona University. AAT 10812107

Broadman, E., 2021. Holocene hydro climate in southern and Arctic Alaska inferred from diatom oxygen isotopes and data–model comparisons. PhD Dissertation, Northern Arizona Univerisity. ProQuest ID 2543425848

Ellerbroek, R.E., 2018. Three-component hydrograph separation for the glaciated Lake Peters catchment, Arctic Alaska.  MSc thesis, Northern Arizona University. ProQuest ID 2112380481

Thurston, L.L., 2017. Modeling fine-grained fluxes for estimating sediment yields and understanding hydroclimatic and geomorphic processes at Lake Peters, Brooks Range, Arctic Alaska, M.Sc thesis, Northern Arizona University. ProQuest ID 2025947690

Datasets

Kaufman, D.S., Fortin, D., Broadman, E., Thurston, L.L., Benson, C. W., Schiefer, E., McKay, N.P., Geck, J., Loso, M.G., Nolan, M., Ellerbroek, R. A., in review. Weather-glacier-river-lake system data for 2015-2018 from an Arctic watershed observatory at Lake Peters, Alaska, National Science Foundation Arctic Data Center, https://arcticdata.io/view/urn:uuid:bfdb3e76-8635-4a61-bbaa-eeb211619c94

Abstracts for professional meetings

Broadman, E., Kaufman, D., Henderson, A., Malmierca-Vallet, I., Leng, M., Lacey, J., 2022. Coupled impacts of sea ice variability and North Pacific atmospheric circulation on Holocene hydroclimate in Arctic Alaska. EGU General Assembly, Vienna, Austria, 23–27 May, EGU22-219. doi: 10.5194/egusphere-egu22-219

Broadman, E., Kaufman, D., Henderson, A.C.G., Malmierca-Vallet, I., Leng, M.J., Lacey, J.H., 2020. Coupled impacts of sea ice variability and North Pacific atmospheric circulation on Holocene hydroclimate in Arctic Alaska. Abstract PP002-0002 presented at 2020 Fall Meeting, AGU, Online, 1-17 Dec.

Schiefer, E., Geck, J., Loso, M., Ostman, J., Mckay, N., Kaufman, D., 2019. Hydrometeorological controls of fluvial suspended sediment transfer and lake sedimentation at Eklutna Lake, Alaska. American Association of Geographers Annual Meeting. Washington DC., 3-6 April. https://aag.secure-abstracts.com/AAG%20Annual%20Meeting%202019/abstracts-gallery/21678

Benson, C., Kaufman, D., McKay, N., Schiefer, E., Fortin, D., 2018. 16,000 years of paleoenvironmental change from the lake Peters-Schrader area, northeastern Brooks Range, Alaska. 48th International Arctic Workshop, Boulder, Colorado, 5-6 April.

Fortin, D., Thurston, L., Schiefer, E., Kaufman, D., McKay, N., 2016. Propagation of fluvial sediment pulses in a glacier-fed lake, Brooks Range, Alaska. ArcticNet Annual Meeting, 5-9 Dec, Winnipeg, MB. Conference Abstracts p 75.

Schiefer, E., Retelle, M., Roof, S., Werner, A., McKay, N., Kaufman, D., 2016. Fluvial suspended sediment yields over hours to decades and beyond in the High Arctic, Lake Linné, Svalbard. American Association of Geographers Annual Meeting.

Observatory Data

The following is a summary of the meteorological, glaciological, fluvial, and lacustrine datasets from a four-year monitoring campaign at Lake Peters. The methods and results are presented in more detail by Broadman et al. and the data are available through the Arctic Data Center. The results provide insight into the processes that control sedimentation in Arctic lakes, context for interpretation of lake sediment sequences, and data for calibration/validation of hydrological and sedimentological models.

Carnivore River Sampling

Description of Lake Peters and its catchment

Lake Peters (69.32°N, 145.05°W) is located at 853 m above sea level on the north side of the Brooks Range. Its catchment includes the third tallest peak in the range, Mount Chamberlin (2712 m), which is 3 km east of Lake Peters. One of the largest glacier-fed lakes in Arctic Alaska, Lake Peters has a maximum water depth of 52 m and an area of ~6.4 km2. The lake’s catchment has 8% glacier cover based on aerial photography acquired in 2016, and receives a majority of stream flow from Carnivore Creek, a 128 kmcatchment with 10% glacier cover. The Carnivore Creek catchment encompasses six extent glaciers larger than 0.5 km² and numerous smaller glaciers, with a median elevation for all glaciers at 1910 m. Since the Little Ice Age, the largest glaciers have reduced in length by over 30%.  Chamberlin Creek is the second largest inflow to Lake Peters. It has a 8 km2 catchment area that is 21% covered by Chamberlin Glacier. Lake Peters drains to the north into Lake Schrader, whose outflow, the Kekiktuk River, discharges into the Sadlerochit River and ultimately the Arctic Ocean. Lake Peters and Lake Schrader (Neruokpuk Lakes) are ice covered from early October through mid-June or July, and often thermally stratify. The basin is north of the modern tree line in a region underlain by continuous permafrost, with a thin active layer where soils are rocky, excessively drained, strongly acidic, and have very thin surface organics. Bedrock within the basin is Devonian – Jurassic sedimentary to meta-sedimentary rocks primarily of the Neruopuk Formation. Climate at Lake Peters is semi-continental, with temperatures more extreme than locations on the coastal plain. A short observational time series of weather from Lake Peters was initiated during the International Geophysical Year in 1962. For the year between May 1, 2015 and April 30, 2016, weather stations installed in Lake Peters basin recorded an hourly averaged temperature of -9.8°C and a liquid precipitation total of 166 mm. During this time period, average temperature was -29°C in December and 8.5°C in July. Strong temperature inversions develop during the winter, with differences as large as 15°C between 850 and 1425 m.

Lake Peters and its catchment.Bathymetric data were collected using a sonar depth recorder along several transects throughout Lake Peters in August 2015. These data were used to create a bathymetric map with ArcGIS 9.1.

Meteorological Data

Three weather stations operated in the catchment from May 2015 through August 2018 along an elevational gradient. The lowest elevation station was mounted on the roof of the cabin at the research station at 850 m near Lake Peters. Additional stations were installed on tripods at 1425 m inside the Little Ice Age moraine of Chamberlin Glacier, and the highest elevation station was at 1750 m at the crest of the left lateral moraine of Chamberlin Glacier. All three stations were equipped with air temperature and relative humidity sensors and ground temperature sensors at 2 and 30 cm depth. The 850 and 1425 m stations were equipped with backup air temperature and relative humidity sensors. The 850 m station was additionally equipped with a barometer, an anenometer, and a pyranometer. At all three stations, tipping bucket rain gauges were installed on the ground away from the stations and equipped with Alter-type windshields to reduce wind-related undercatch.

Meteorological stations at (a) 850 m, (b) 1425 m, and (c) 1750 m
Temperature and precipitation observed at the 850 m station

Glaciological Data

The surface elevations of Chamberlain Glacier and seasonal snow cover were observed using ablation stakes and interval photography. Graduated stakes were installed at two sites along the lower (1772 m) and upper (1860 m ) regions of the glacier. Photographs captured exposed stakes height using time-lapse cameras that automatically recorded every 6 hours. Ablation stake heights were observed on photographs at a precision of 1 cm. Air temperature sensors recorded mean hourly temperatures 2 m above the snow surface at each site.

Chamberlin Glacier (a) ablation stake, and (b) radiation shield and camera

Fluvial Data

Two hydrological stations were established in May 2015: one at Carnivore Creek and one at Chamberlin Creek. At each station, an In-Situ TROLL 9500 was deployed during the open-channel season to measure pressure, temperature, conductivity, and turbidity, and a water level logger was used for backup measurements of pressure and temperature. In addition to these continuous datasets, discrete discharge (Q) and suspended sediment concentration measurements were taken using a hand-held flow meter and a suspended sediment sampler. Water pressure was corrected using barometric pressure measurements from the 850 m weather station and then converted to stage. Discrete field sampling of discharge was most frequent and spanned the greatest range in 2015.

Stream stage gauges at (a) Carnivore and (b) Chamberlin Creeks. Instrumentation mounted in PVC tubing is obscured by stage gauges.
Discharge and conductivity for (top) Carnivore Creek, 2015-2018, and (bottom) Chamberlin Creek, 2015-2017.

Limnological Data

Hourly water level measurements were taken using water level loggers installed on anchored moorings near the water’s surface at two locations in Lake Peters: one in its central basin and one near its outflow. Pressure data were corrected to water depth using barometric pressure measurements from the 850 m weather station.  Throughout the 2015 field season, a series of TROLL cast transects were taken to provide temperature, turbidity, and conductivity data at stations along a north-south transect throughout Lake Peters. Pressure measurements from the TROLL were converted to water depth, providing vertical profiles for these data. These casts were performed at a varying number of stations on a total of 33 days over the course of the field season. In 2015, 2016, and 2017, lake temperature and luminous flux data were collected at various water depths on anchored moorings throughout the lake.

Turbidity in Lake Peters over the course of a high precipitation event in July 2015: (a) July 14, (b) July 18, (c) July 21, (d) July 26, and (e) composite data from July 29 and July 30. Black shading indicates lake bathymetry, and black dashed lines indicate locations of TROLL casts. The x-axis indicates north-south distance across the lake from the outflow of Carnivore Creek. Figure created using Ocean Data View (ODV) software

Sediment Trap Data

Throughout 2015-2017, sediment traps were deployed in Lake Peters to measure the rate of deposition and collect suspended sediments in the lakes. In 2015, three pairs of static traps with different aspect ratios were deployed from May-August at a central location of Lake Peters to determine the effect of these proportions on sediment collection efficiency. From May-August 2016 and again from August 2016 through August 2017 one static trap was deployed in Lake Peters. This trap consisted of 2 L plastic bottles with the bottoms removed, a 50 ml centrifuge tube secured to its mouth, and inverted to funnel sediments into the tubes. Each trap comprised two or three replicate tubes/bottles deployed at different depths along an anchored mooring. In addition, an incrementing sediment trap was deployed from May 2016 through August 2017, collecting sediments in 23 bottles rotating over daily to weekly increments.  For all sediment samples, dry sediment mass, daily flux, and annual flux were calculated. For several static trap samples, grain size data were determined.

Types of sediment traps installed in Lake Peters: (a) installation of static traps ratio traps, (b) static traps upon retrieval, and (c) installation of an incrementing trap.

Photogrammetric Data

Airborne photogrammetric data were acquired two times in 2015, three times in 2016, and three times in 2017. These data were used to create raster orthomosaics and digital elevation models. When conditions permitted, the entire Carnivore Creek watershed was acquired. On all other dates, only the eastern side of the valley, where the catchment glaciers are located, was captured. Accuracy within this steep mountain environment was found to exceed 20 cm horizontally and vertically without use of ground control. Data acquisition methods are described in detail in Nolan et al. (2015). These DEMs were used to create difference DEMs to measure snowpack thickness throughout the entire watershed (spring minus late summer for each year), as well as glacier surface elevation change (August of one year minus August of the following year). The accuracy of these DEM-derived snow thickness measurements has previously been found to be comparable to those acquired using hand probes.

Geochemical Data

A total of 187 water samples were collected from the Lake Peters catchment between 2015 and 2018 and analyzed for oxygen and hydrogen isotopes. These data, combined with conductivity measurements, were input to a hydrograph mixing model to estimate the relative contributions of various water sources to Carnivore and Chamberlin Creeks. Sampling intervals varied by location but were approximately every 2-6 days when a field team was present. In one 24-hour period in August 2016, each creek was sampled every two hours. These Creek samples were also analyzed for major cation and anion geochemistry analysis using an ion chromatograph. Water samples were also collected from three unnamed glaciated tributaries in the Carnivore Creek valley and three unnamed non-glacial streams that intermittently drain into Lake Peters. Winter precipitation samples were collected from multiple locations. Twenty-seven snowpack samples were collected with snow density measurements. Samples of glacial melt, glacial ice, and snow drifts were collected. Rain samples were collected sporadically after storm events from spill off from the roof of G. William Holmes research station.

Tracing a Precipitation Event

To examine how precipitation works its way through the Lake Peters catchment system, and to depict a small subset of the available data, multiple datasets are shown for a precipitation event in the latter half of July 2015 (see figures below). During this event, the 850 m weather station recorded a total rainfall of 22.4 mm between July 17-20. In response, hydrological stations at both Carnivore and Chamberlin Creeks recorded an increase in discharge to Lake Peters, with Carnivore Creek discharge reaching far higher values due to its larger catchment. Discharge then decreased over several weeks, long after the precipitation event concluded, with diurnal fluctuations illustrating the effect of glacial melt. Turbidity increased in both creeks, coincident with the beginning of elevated discharge. The influx of water increased the water level of Lake Peters, which lagged, likely as a function of the total integration of new water as well as outflow into Lake Schrader. This event had several additional effects on the water of Lake Peters: Turbidity in Lake Peters increased during the event, the inflow of water caused a temporary drop in water temperatures closer to the lake surface, and the amount of luminous flux a few meters below the water’s surface dropped. Isotopic values were also recorded from rainfall and creekwater at several moments during this event.

To quantify the spatial characteristics of the sediment pulse entering Lake Peters during this precipitation event, data from TROLL casts taken throughout the lake on multiple days before, during, and after the event were examined. These data indicate that the spatial pattern of turbidity anomalies throughout Lake Peters is more complex than that captured at a single, proximal station.

This multifaceted perspective of a precipitation event represents only a small fraction of the total data produced by this field effort, but illustrates both the interconnectedness of processes in the Lake Peters catchment and the potential for these datasets to further our understanding of Arctic weather-glacier-river-lake systems dynamics.

An example of the observatory’s data, tracing the effects of a precipitation event in July 2015. (a) Rainfall at the 850 m station; (b) Carnivore and Chamberlin Creek discharge and (c) turbidity; (d) Lake Peters relative water level, (e) maximum turbidity at Lake Peters station 1, (f) water temperatures at different heights above lake bottom at Lake Peters station 3, and (g) luminous flux at Lake Peters station 7; and (h) δ18O at different sites.

Acknowledgements

Datasets from the Lake Peters watershed were collected with the help of numerous field assistants, including Zak Armacost, Mindy Bell, Ashley Brown, Anne Gädeke, Jeff Gutierrez, Rebecca Harris, Stacy Kish, Lisa Koeneman, Anna Liljedahl, Maryann Ramos, Doug Steen, and Ethan Yackulic. Sedimentary grain size data were processed with assistance from Daniel Cameron and Katherine Whitacre. Water isotope analyses were performed with assistance from Jamie Brown at NAU’s Colorado Plateau Stable Isotope Facility, and major cation and anion analyses were performed by Tom Douglas of the U.S. Army Cold Regions Research and Engineering Laboratory. We thank the U.S. Fish and Wildlife Service – Arctic National Wildlife Refuge for use of the G. William Holmes research station and for permitting our research; Polar Field Services, Inc./CH2MHill for support and outfitting while in the field; Dirk Nickisch and Danielle Tirrell of Coyote Air for safely flying our field teams to and from Lake Peters; LacCore/CSDCO for assistance with processing and archiving of sedimentary sequences from Lake Peters; and PolarTREC for a productive partnership that contributed greatly to the broader impacts of this project. This project was funded by NSF-1418000. Forgive us if we neglected to acknowledge anyone. Please let us know if we missed you.

Outreach and Education

PolarTREC Project

Rebecca Harris, a PolarTREC teacher from Escalante, UT joined the team at Lake Peters. You can read her posts from the field here.

Kaktovik School and Community Outreach

Both Rebecca Harris and Ellie Broadman headed to Kaktovik, Alaska on August 22, 2017 to do a presentation to the students in the school and to the community in the evening. You can read more about their outreach here.

Students at Harold Kaveolook School in Kaktovik, AK learn how sediments settle out in the water

NAU News

Link to the Spring 2017 NAU News story: “Outside the Lab: NAU field researchers provide school teachers hands-on education

Excerpt: “The rapid climate changes of recent decades have profoundly impacted the natural environment, politics and societies worldwide, and these impacts are projected to continue to intensify in the future,” said graduate student Ellie Broadman, one of the field researchers at Lake Peters. “Because of the severity and large-scale of its impacts, climate change is extremely important to understand and is therefore usually a key topic in earth and environmental science curricula in middle and high schools. It’s important that students understand that all the buzz about modern climate change isn’t just hyperbole; it’s based on long-term, in-depth understanding of climatic and environmental systems.”

Rebecca Harris, Escalante High School Teacher, joined the Alaska Glacial Lakes Project in Summer 2017

A Successful Spring Field Season

David Fortin, Lisa Koeneman, and Zak Armacost spent three weeks at Lake Peters in May, 2017. This was a relatively cold and snowy spring at Lake Peters but the team had a productive season. The team took daily discharge measurements, installed a sediment trap, took a network of sediment cores, and maintained the weather stations and the ice ablation measurement stations on Chamberlin Glacier.

David Fortin and Zak Armacost on Lake Peters

Glacial Lake Project Workshop

Principal Investigators and students from Northern Arizona University, Alaska Pacific University, and University of Alaska Fairbanks, met in Flagstaff on January 23-24, 2017.

Meeting group at Northern Arizona University, Flagstaff.

2016 Field Season Report

Our fieldwork at Lake Peters is finished for the year. During the past three weeks, moorings were fished from the lake to retrieve data loggers and sediment traps deployed last year, rivers were waded to gauge their discharge and sediment load, bihourly sediment samples were collected for two days from both rivers to capture their diurnal fluctuations in water isotopes and geochemistry, and weather stations were repaired and refortified to guard against future animal encounters. The hard fieldwork this month was accomplished by two exceptionally capable graduate students, Stephanie Arcusa and Ellie Broadman. Now comes the excitement of new discovery as we analyze samples from the lake, glacier, and rivers, and explore the data from our instruments.

Ellie Broadman, NAU, collecting data from the Chamberlin Glacier weather station.

Thank You

We thank many who have helped us succeed: the National Science Foundation for selecting our project among the many proposals worthy of funding, the Arctic Refuge office of the US Fish and Wildlife Service for support of scientific understanding and stewardship of wilderness, CH2MHill-Polar Services for experienced logistical support, Coyote Air for exceptionally capable service, and G. William Holmes for recognizing the outstanding research opportunity afforded by Lake Peters when the station was established there in 1958.